Are people getting less from the NHS?

Overview
Prior to the COVID-19 pandemic, the NHS typically delivered productivity growth at a faster rate than both the rest of the public sector and the wider economy. However, the pandemic caused significant disruption and has slowed progress in this area. This is in line with many health systems across the world. The most recent productivity figures (2021/22) suggested that the NHS was still performing below the pre-pandemic level, but experimental analysis suggests improvement in 2022/23, which is starting to bring overall productivity in line with 2019 figures.
A complicating factor is that NHS productivity is challenging to quantify. The Office for National Statistics (ONS), the most authoritative source for data on NHS productivity performance, measures healthcare productivity as the amount of service provided (for example, surgical procedures, GP consultations, outpatient attendances) for the quantity of inputs used (for example, staff, medical equipment, drugs). The two most important inputs for healthcare are staff and money, both of which have increased since the eve of the pandemic. Between December 2019 and December 2022, the number of full-time equivalent (FTE) junior doctors increased by 16.4 per cent, and the number of nurses and health visitors increased by 10.9 per cent. At the same time, the NHS England budget increased 25.5 per cent from £123.8 billion in 2019/20 to £155.4 billion in 2022/23.
Despite these increases, across some important metrics, the number of people the NHS treats is lower than it was before the pandemic and in some it is marginally higher, suggesting overall lower productivity. This has led some commentators to suggest the NHS has more money and staff than ever before but is delivering less in terms of the number of operations, appointments and other forms of activity.
However, not only does a single figure for productivity fail to highlight areas of improvement, it also does not capture the full picture of the work of the health service, such as the benefit of spending on preventative services which reduces costly hospital care. Moreover, there are a number of complex issues facing the NHS that are important to keep in mind when looking at productivity values. This article discusses these in turn, with the aim of contextualising these figures.
Exploring the evidence

Funding
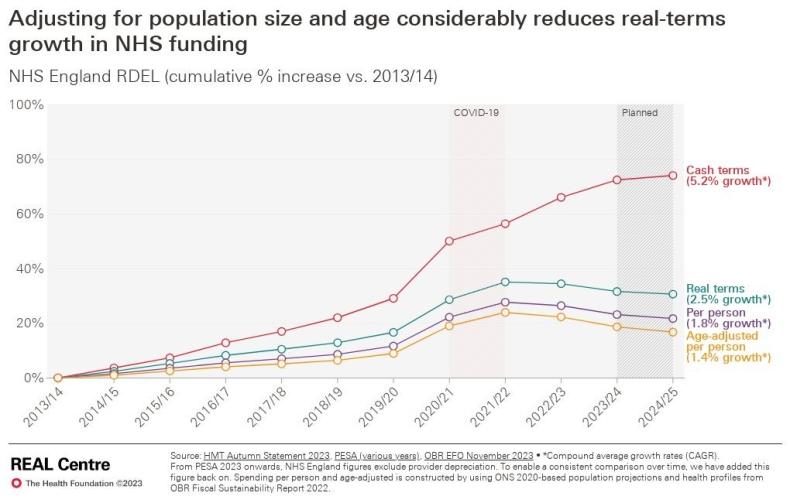
Over the last decade, English NHS funding has increased at historically low levels. Since 2019/20, health spending has increased by 3.0 per cent a year in real terms, which is lower than the average yearly growth rate of 3.8 per cent since 1979/80, although higher than the average growth rate of 1.4 per cent between 2020 and 2019. While the 2024 Spring Budget announced an increase of £2.5 billion to NHS England’s 2024/25 budget, this has little impact in real terms, increasing the budget by 0.2 per cent from 2023/24. Moreover, when adjusted for the ageing and growing population, the average annual growth in NHS spending since 2019/20 is 1.7 per cent per person. This is demonstrated in Figure 1.
Figure 1
Not only is this insufficient to fund the services required for our growing and ageing population, with more people living with multiple long-term conditions, but there are also additional requirements for the NHS in the post-pandemic landscape. For example, further infection control and vaccination requirements, both of which require funds not considered pre-pandemic.

Capital investment
Poor capital investment hinders worker productivity, as poor quality or outdated IT, equipment (such as scanners) and estates can lead to lost clinical time. For example, in the last two years alone, clinical services were halted by 12,000 estates failures. Although the effects of capital investment often stretch out for years if not decades, we have consistently invested less than our OECD peers. Capital underinvestment limits the ability for staff and funding to be used as effectively as possible, especially as we deal with more complex health conditions and an ageing society.
Moreover, the NHS’s capital budget has been raided over the last decade to plug holes in the revenue budget. In the last financial year (2023/24), supplementary estimates from HM Treasury revealed that almost £1 billion was transferred from the capital budget for health infrastructure to cover cost pressures resulting from unfunded pay rises for NHS staff and for industrial action. This reduction in capital has an impact. The maintenance backlog in the NHS, for instance, has more than doubled in real terms from around £5 billion in 2012/13 to £11.6 billion in 2022/23.
An increased ‘acuity’ best demonstrated by an older population

The care we now provide is more complex and expensive than ever as our population ages and lives with more long-term conditions. It is a worldwide experience that as our societies age and become wealthier with less healthy lifestyles, healthcare becomes more expensive in both technology and medicines. The UK is no exception. The numbers of people in England aged 65 and over increased by more than 400,000 alone in the five-year period from 2017/18 to 2021/22.
Over the same period, the number of people aged over 85 increased by 3.1 per cent to 1.4 million. The likelihood of living with multiple or complex long-term health conditions, disability and/or frailty rises directly in line with age, and with it the likelihood of needing to draw on care and support. Moreover, on average patients with increased acuity and frailty have a longer length of stay in hospital, which can affect patient flow and give the impression of lower productivity. In fact, analysis indicates that at least half of the increase in length of stay of emergency admissions can be explained by patient complexity.
As a result, this increased demand and complexity makes productively reducing the backlog harder than in the past, especially with the wrong staffing mix.

More junior staff, fewer managers, higher sickness levels
The staffing mix is more junior and undermanaged. Although the number of staff working for the NHS in England has increased substantially since 2015, this overall picture of more staff hides two important things.
Firstly, the end of the pandemic saw turnover in experienced staff. Turnover rates pre-pandemic were between 7 and 8 per cent, rising to 11 per cent in September 2023. In addition, there has been a necessary influx of more junior staff. For example, a Nursing and Midwifery Council (NMC) report highlights an increase in over 24,000 people aged 21-40 on their register between 2022 and 2023, which equates to growth of 7.9 per cent. Similarly, analysis of GP Workforce Statistics shows that 42 per cent of all FTE GPs were under 40 in March 2024, up from 38 per cent in March 2019.
This reduction in experienced members of staff will hinder productivity; those towards the latter end of their career have a wealth of skills that are vital for high-quality and efficient service for patients. Not only that, but this could lead to an increased demand on existing clinical staff to train and develop newer staff. This has an impact on productivity in the short term, though will reap longer-term benefits.
Secondly, the NHS is undermanaged when compared to comparable international health systems and other industries. Managers make up circa 2 per cent of the NHS workforce, compared to 9.5 per cent of the overall UK workforce. The NHS also spends less on administration than its counterparts: in 2019, the NHS in England spent around 2p in the pound, compared to 5p in Germany and 6p in France.
Indeed, the number of managers across the NHS has decreased between 2010 and 2019, while integrated care boards are now having to deliver a 30 per cent real terms reduction in their running costs by 2025/26, with at least 20 per cent to be delivered in 2024/25. This will result in further reductions in managers.
Given the current pressure to meet efficiency savings targets, health leaders report that cutting both clinical and non-clinical staffing numbers will be necessary to reduce their spending. The implications of having fewer clinicians are obvious when it comes to delivering care and reducing waiting times; however fewer managers means clinicians must spend more time performing the tasks that managers otherwise would. This reduces the time they have for clinical work. In fact, evidence suggests that increasing management can lead to wider benefits for the workforce: a rise from 2 to 3 per cent of NHS workforce has been found to correlate with a 5 per cent increase in hospital efficiency.
Finally, the NHS has also experienced significant staff burnout during and since the pandemic. NHS staff sickness absence rates are still higher than in 2019, and mental health conditions such as anxiety and stress made up nearly a quarter of total sickness absence in January 2024.

Poor patient flow across the health service
Underinvestment and poor staffing in other health, social and community services affects the flow of people through the system and means the NHS can’t treat as many patients as it otherwise could. NHS England has cited ‘reduced flow through the urgent and emergency care pathway and across the system’ as a key driver of lower productivity since the pandemic. It also points to lengths of stay, which have increased for non-elective patients during and since the height of the pandemic ‘beyond the observable impact of case acuity’, combined with constrained capacity (in and out of hospitals), resulting in lower throughput.
Issues with discharging patients to the right settings – such as social and community care – continue to hamper NHS efforts to use beds in the most efficient manner. This is particularly challenging given that the number of general and acute beds in the NHS fell by 44 per cent between 1987/88 and 2019/20. In April 2024, for example, on average 12,772 patients a day remained in hospital - out of a total of approximately 100,000 beds - because they could not be discharged elsewhere. This is often due to a lack of available care packages in social and community care.
There are three notable negative consequences of delayed discharge. Firstly, it can lead to for the patient, such as increased risk of infection and loss of mobility. Secondly, it leads to increased expenses for hospitals. In fact, one study found that preventing delayed discharge could save up to 30.7 per cent of total hospital costs per patient. Finally, and most importantly for productivity, it impacts patient flow throughout the whole health system. Beds blocked by delayed discharge can lead to of elective operations, thus delaying treatment for others. Moreover, high bed occupancy rates also make it patients, affecting the urgent care system more generally, as well as the ambulance system and A&E.
Fixing issues with delayed discharge and patient flow would require a sustainable solution to the funding and capacity issues within social care. Despite the government committing £5.4 billion over three years, as well as existing budgets, to reform social care in 2021, this was decreased to £729 million for 2022/23 and 2024/25, and the sector vacancies exceeded 152,000 in March 2023. In addition, in the 2022 Autumn Statement the Chancellor announced that the ‘Dilnot reforms’ to adult social care in England, which were originally due to be implemented from October 2023, would be delayed for two years. The lack of a sustainable solution to the social care crisis, including the constrained funding the sector continues to receive, means the NHS has no choice but to pick up the slack and suffer the productivity consequences as a result.
Impact of industrial action

The NHS has been embroiled in a long-running industrial dispute that started in December 2022, and is continuing with ongoing strikes by junior doctors planned in June 2024 and possibly beyond. This has resulted in direct costs of around £1.5 billion, as well as the loss of elective activity. NHS England analysis estimates that the industrial dispute has had an impact on NHS productivity of around 3 per cent. It reports: ‘adjusted productivity would be around 11 per cent lower than before the pandemic or 8 per cent if we adjusted for the impact of industrial action’.
All the factors explored here have, and will likely continue to, impact NHS productivity. However, given the size of the NHS and the complexity of creating a national picture, even NHS England says there is a gap in productivity it cannot explain from national data. It cites difficult-to-measure or more long-term changes, such as the impact of reduced staff discretionary effort or improving ward fill rates that are expected to positively impact staff welfare and retention, patient safety and therefore longer-run productivity.
Progress not captured by headline productivity statistics
In the midst of these challenges, demand continues to soar. For example, this March (2024) had the highest A&E attendance in the NHS’s history; and the number of GP appointments continues to rise regardless of a continuing decrease in GP numbers.
Despite all this, the NHS continues to make progress against key metrics, for example:
- More than three million urgent suspected cancers referrals were seen in 2023/24, which was up 5 per cent on 2022/23.
- For urgent and emergency care, there were 11 per cent more patients admitted and discharged on the same day and a 3 per cent decrease in average length of stay for those staying overnight in 2023/24 compared to 2022/23.
- Completed diagnostic tests have risen to above pre-pandemic levels, with a record number of tests performed in January 2024 (see Figure 2).
- The elective waiting list has fallen each month for the last six months (October 2023 to March 2024), driven by significant outpatient activity, consistently completing over 100 per cent of the completed pathways of the 2019/20 baseline (see Figure 3).
Figure 2
Figure 3
On the input side, the NHS has also made significant progress, such as improving staff engagement and attendance while focusing on reducing expensive agency costs. Spending on agency staff has reduced by 13 per cent from £3.5 billion 2022/23 to £3 billion in 2023/24. It was 3.6 per cent of the total NHS pay bill, which is the lowest level of agency spending since at least 2017/18.
The bottom line
Despite the NHS having typically delivered productivity growth at a faster pace rate than the rest of the public sector and wider economy before the pandemic, the significant disruption to services caused by the pandemic has slowed progress. This is in line with many health systems across the world.
While NHS productivity is complex and difficult to quantify as the measures often do not capture the full range of patient-related quality and outcomes delivered, and often not delivered in year, overall productivity has reduced. However, there are a range of contributing factors that need to be taken on board, including how our population needs are more complex and acute; higher NHS sickness absence rates than in 2019; the impact of industrial action; and longer lengths of stay for non-elective patients.
Despite these challenges, it is important to acknowledge the areas in which the NHS is making strong progress, such as treating more urgent suspected cancers referrals, reducing overnight admissions and discharge delays in urgent and emergency care, slowly bringing down the size of the elective waiting list, and reducing spending on agency staff.
Read more from our series of explainers, providing facts and figures to challenge common misconceptions in health and care.


