Is there geographic variation in the spread of seasonal viruses?

Key points
- This article explores the geographical variation of patients in hospital with each of the four viruses reported in NHS England’s winter situation reports using a snapshot of week 2 of 2024/25 (6 – 12 January 2025). It looks at whether areas that had surges of demand for flu beds also had surges of the other viruses simultaneously.
- While each virus showed a different geographic variation, two integrated care boards (ICBs) saw notably high levels: North East and North Cumbia and Hampshire and Isle of Wight ICBs.
- There is a statistically significant positive relationship between the number of occupied flu beds and both COVID-19 and diarrhoea and vomiting (D&V) occupied beds, meaning that ICBs with higher levels of flu beds are more likely to see higher levels of COVID-19 and D&V beds as well.
- However, when looking at the relationship between flu beds and other virus beds per 100,000 population in the ICB, there was no statistically significant relationship. This might suggest that the positive relationship highlighted above is reflective of the population of the ICB, rather than the manner in which these viruses spread.
- While this winter has been challenging across the healthcare sector, it is important to consider the additional difficulties experienced by any ICB seeing high numbers of beds taken up with viruses, especially when considering performance indicators.
Overview
This winter has been a particularly challenging season for the NHS in terms of viruses so far. In fact, the threat caused by these viruses has been described as “really concerning” by Professor Sir Stephen Powis, NHS national medical director, and the NHS Confederation’s chief executive, Matthew Taylor, referred to these pressures as placing NHS services and patients in “a position of national vulnerability”. Moreover, NHS officials have coined the phrase ‘quad-demic’ to refer to the additional pressure put on NHS by four viruses: flu, respiratory syncytial virus (RSV), COVID-19 and norovirus.
Frontline NHS departments have been struggling with increased demand attributed to high levels of these viruses. Indeed, several hospitals including those in Gloucestershire, Northamptonshire and Birmingham have declared critical incidents due to high demand attributed to high levels of flu. Critical incidents are when services are already at full capacity but are seeing mounting pressure and enable the NHS to prioritise urgent care and expand capacity if possible.
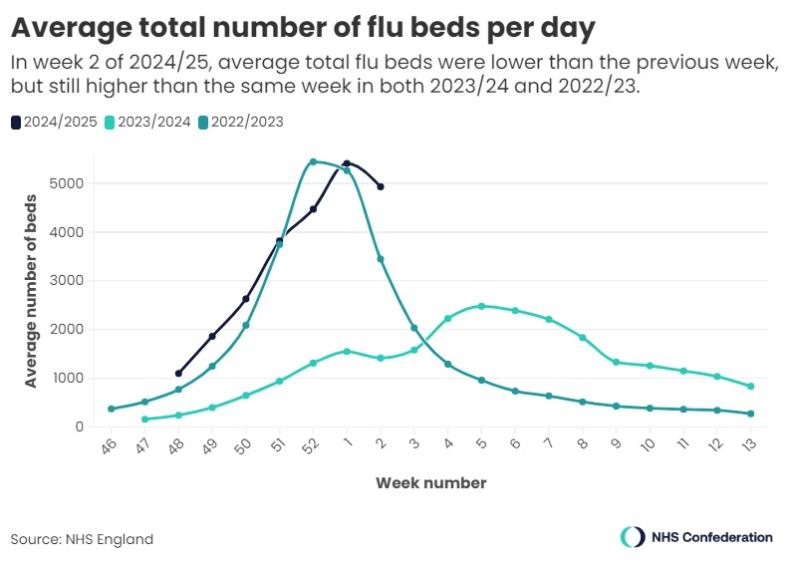
Looking at the national picture, the latest data from the Urgent and Emergency Care Daily Situation Reports shows that there are more flu beds on average per day than at the same time in the previous two years, as shown in the graph (figure 1) below. Week 2 of 2024/25 is nearly 3.5 times higher than week 2 of 2023/24.
While this number had been increasing steadily since week 48 of 2024/25 (the first week covered by the situation reports), week 2 finally saw a drop in flu beds compared to the week before. However, without more data, it is not yet possible to determine whether this means the peak has been reached.
This trend is consistent across several flu metrics; the UK Health Security Agency’s flu and COVID-19 surveillance reports for week 2 have the same conclusion; multiple flu-related indicators are starting to decrease which may indicate that a peak has been reached.
However, increased pressure has not affected all areas of the country equally, and some trusts have seen more extreme surges of flu than others, affecting their capacity differently. This article seeks to explore the geographic variation of the bed occupancy for the four viruses reported in the situation reports: flu, COVID-19, respiratory syncytial virus (RSV), and norovirus, identifying whether areas that had increased demand for flu beds also had surges of demand for beds for the other viruses simultaneously.
Data and methodology
This article will provide a snapshot of the average figure per day for week 2 of 2024/25, 6 to 12 January 2025, as this is the most up-to-date situation report data at the time of writing. The data is provided at trust level, but for this work has been aggregated to integrated care system (ICS) level so that the trends can be viewed at this scale. While patient intake comes from multiple different footprints, each trust is a member of only one ICS and thus can be aggregated to that scale.
The analysis focuses on the number of beds taken up by patients with viruses in each ICB as it specifically examines the pressure that the systems are under as a proportion of the national total. This is further contextualised with data on the population size of each ICB, with which the bed rate per 100,000 people in the ICB is calculated.
Results
This section describes the geographic pattern of each virus in turn, before discussing the relationship between them.
Flu
Flu is a disease caused by a respiratory virus that leads to a range of symptoms including aches, exhaustion and a cough. While it will often get better on its own, patients with certain conditions are at higher risk of developing serious complications from flu, which can lead to hospitalisation.
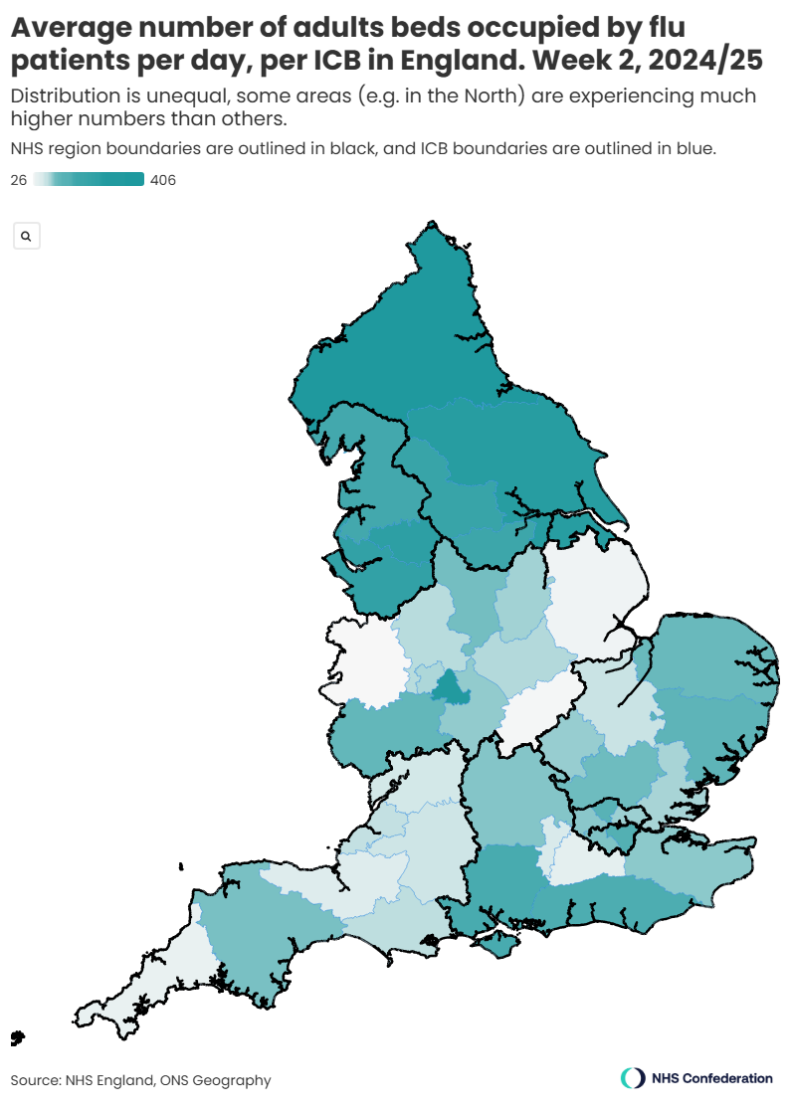
As highlighted above, high levels of flu have caused problems for the healthcare system this winter. When we look at the number of flu beds (both general and acute and critical care) separated by ICB as shown in the map below (figure 2), we can see a clear north-south divide, with ICBs in the regions of North East and Yorkshire and North West experiencing higher levels of flu bed occupancy than those to the south, with the exception of Birmingham and Solihull ICB. Indeed, Birmingham and Solihull ICB had the highest level of flu beds per 100,000 people at 20.12 beds.
If we compare the ICB that had the highest numbers of flu beds (North East and North Cumbria ICB, 406 flu beds a day) and that with the lowest (Shropshire, Telford and Wrekin ICB, 26 flu beds a day), we can see that North East and North Cumbria ICB had more than 15 times more flu beds occupied per day than Shropshire, Telford and Wrekin ICB in week 2, despite the population being less than six times larger. Moreover, North East and North Cumbria ICB had 8.2 per cent of all flu beds nationally, despite serving 5.3 per cent of England’s population, demonstrating that this ICB had a larger proportion of the total flu beds than expected for its population size.
However, when looking at the beds by 100,000 people in the ICB, Birmingham and Solihull ICB had the highest rate (20.16 beds), and Northamptonshire ICB had the lowest (3.91 beds). This shows that even when adjusted for population size, there is a great deal of variation in the distribution of flu across the country.
COVID-19
COVID-19 is the disease caused by the respiratory virus SARS-CoV-2 and causes similar symptoms to flu. Like flu, it will often get better on its own, but some people are unwell more seriously and for longer or suffer from complications.
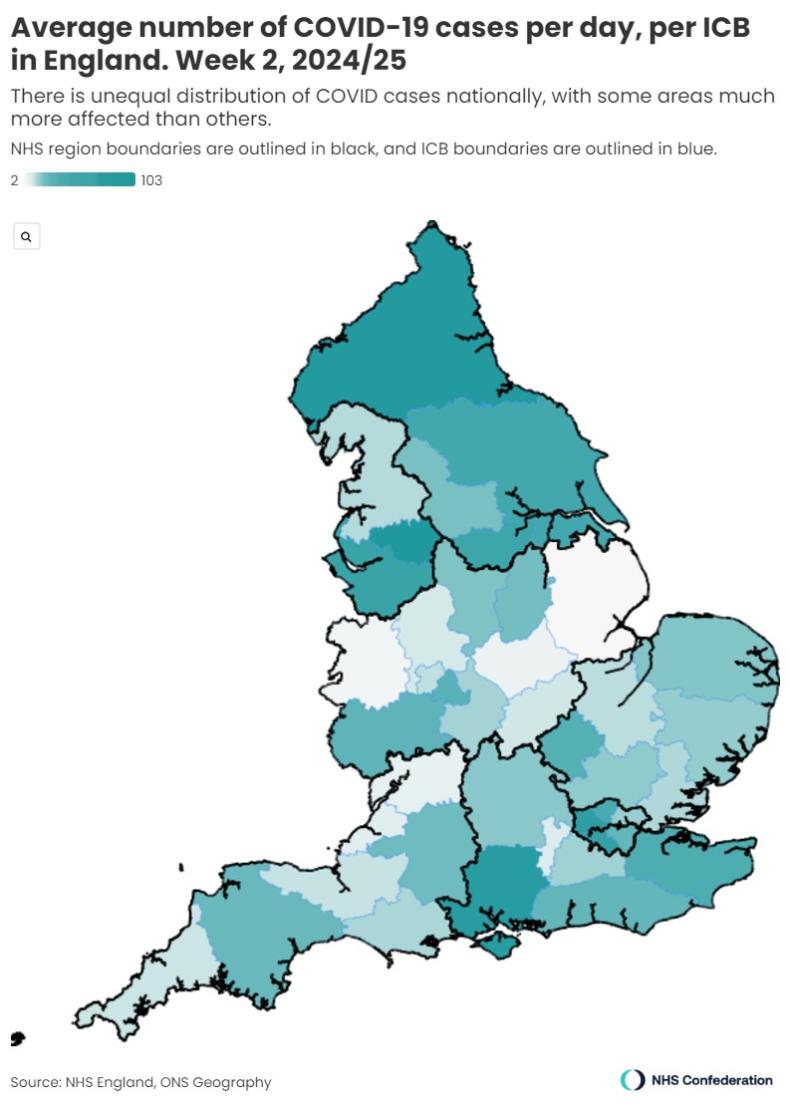
COVID-19 bed occupancy levels were far lower this winter than at the same point last year (nationally 1,112 beds in week 2 of 2024/25 compared with 3,946 in week 2 of 2023/24). However, some ICBs were experiencing dramatically higher levels than others; in week 2, Greater Manchester ICB had 104 beds occupied by COVID-19 patients a day, compared with two beds a day in Lincolnshire ICB. There is also a stark difference when we look at this averaged out by population; 3.56 beds per 100,000 people in Greater Manchester ICB, compared with 0.26 beds per 100,000 in Lincolnshire ICB.
When looking at the geographic distribution of COVID-19 beds as shown in the map below (figure 3), there was a less stark national picture than seen for flu beds. Despite this, there does appear to be a pocket of higher levels of COVID-19 beds in the South East (including particularly high levels in Hampshire and Isle of Wight, North West London and South West London ICBs) and areas of the North (including Greater Manchester ICBs). When looking at COVID-19 beds per 100,000 population, these four ICBs also had the highest rates, with South West London ICB having the highest rate (4.58 beds), followed by Hampshire and Isle of Wight ICB (3.84 beds).
Respiratory syncytial virus (RSV)
RSV is a virus that causes coughs and colds. While a patient will usually get better on their own, some people can get more seriously ill, including babies and people over 75.
The NHS England situation reports only include data on paediatric RSV. The data provides figures on the number of beds closed, which does not necessarily equate to the number of patients, as some beds are closed for infection control purposes, as well as the number of occupied beds. This article refers to the number of occupied beds, rather than the number of beds closed, as it is focusing on the virus spread rather than the healthcare system’s response.
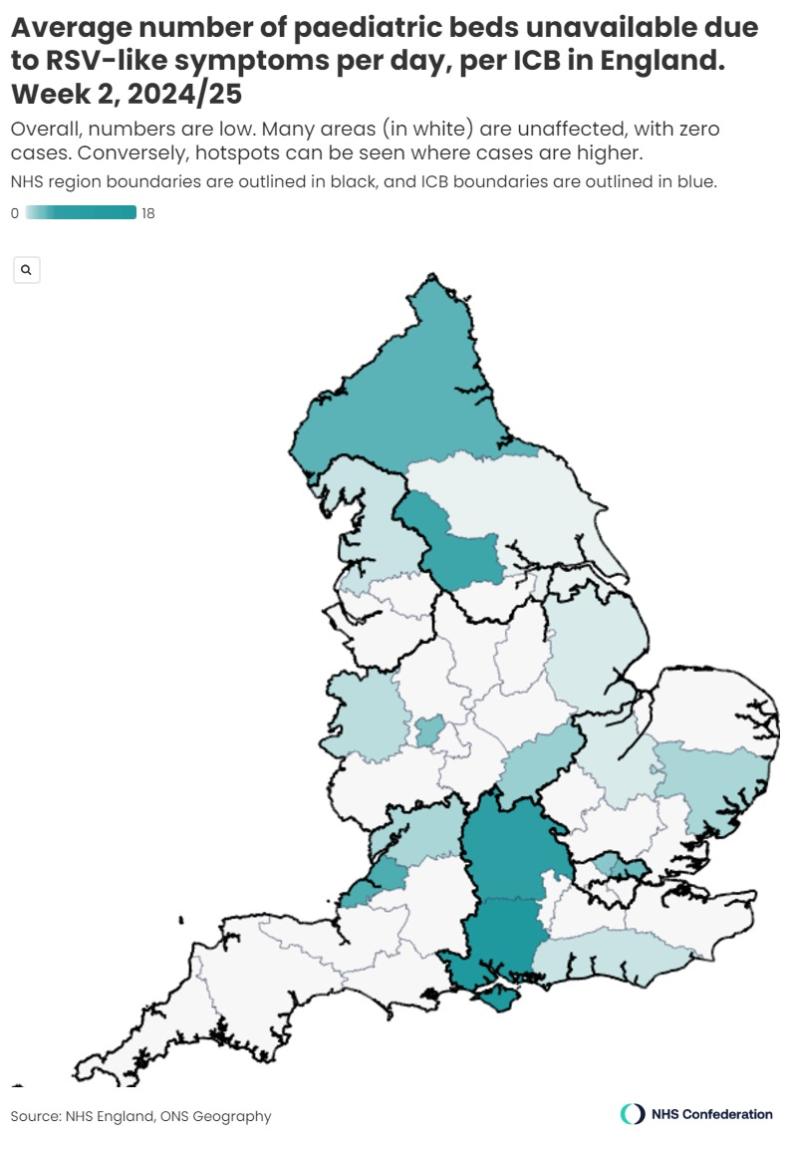
In week 2, the numbers of beds occupied with RSV patients was considerably lower than for the other viruses discussed here. Nationally, week 2 saw 52 RSV beds occupied. However, for the ICBs that have high numbers of occupied RSV beds, this will undoubtedly have been adding to overall winter pressures and therefore has been included in this article.
Of the 42 ICBs in England, more than half (24) had less than one bed a day occupied with RSV patients in week 2, as shown in the map below (figure 4). While these ICBs are therefore unlikely to have felt any additional pressure from this particular virus at this time, this is not the case for all ICBs. Hampshire and Isle of Wight ICB, for example, had 18 RSV beds occupied per day. This is considerably higher than the next highest ICB, its neighbour Buckinghamshire, Oxfordshire and Berkshire West ICB, which had five beds occupied per day.
In terms of national patterns, there was a cluster of the two ICBs with the highest levels of occupied RSV beds in the south; Hampshire and Isle of Wight and Buckinghamshire, Oxfordshire and Berkshire West ICBs, as well as other localised clusters around, for example, North Central London and North East London ICBs. There were also large areas that had less than one RSV bed occupied a day in week 2, such as large parts of the South West region and a large part of the Midlands region.
When looking at occupied RSV beds by 100,000 people in the ICB, only one ICB had more than one bed per 100,000 people; Hampshire and Isle of Wight ICB (1.00 beds). All other ICBs had fewer than 0.4 RSV beds per 100,000, again demonstrating the geographic variation of bed occupancy distribution.
D&V/norovirus
Norovirus causes diarrhoea and vomiting (D&V). Although it can usually be treated at home, it can require hospital treatment. The data that is provided in NHS England’s situation report covers ‘D&V/norovirus like symptoms’, which therefore potentially includes other viruses that cause the same symptoms.
The NHS England situation reports separate data on D&V into adult and paediatric patients. For this article these have been combined to show an overall D&V patient number. As with RSV, data on D&V is separated into the number of beds closed, and the number closed for infection control purposes. This piece looks at the number of occupied beds, rather than the number of beds closed.
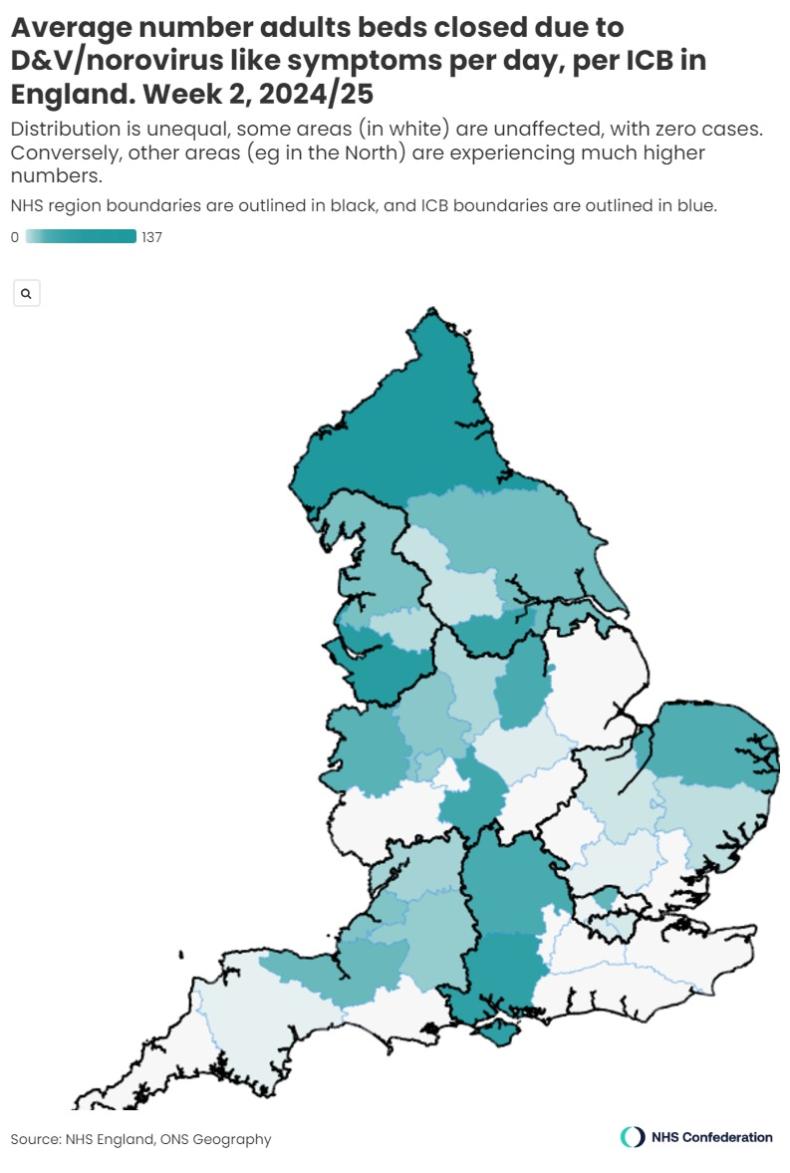
Looking at the national picture, there was a band of ICBs to the east of the country that had relatively few D&V beds occupied in week 2, spanning the East of England region (with the exception of Norfolk and Waveney ICB) and the eastern part of the South East region. This is evident in the map below (figure 5).
The ICB with the highest number of D&V beds occupied was North East and North Cumbria ICB (137.86 beds), and there were 12 ICBs that had less than one D&V bed occupied. This shows that there is a range of over 130 beds between the busiest and quietest ICBs in relation to D&V beds, again demonstrating the degree of variation experienced across the country.
When looking at occupied D&V beds per 100,000 people in the ICB, Shropshire, Telford And Wrekin ICB had the highest rate (4.62 D&V beds), closely followed by North East and North Cumbria ICB with 4.59 beds. Moreover, when examining these numbers as a proportion of the total occupied D&V beds in England, North East and North Cumbria ICB had 21.2 per cent of all occupied D&V hospital beds, showing a disproportionate share of D&V-attributed pressure here when compared with its 5.3 per cent of the national population.
Relationships
While each of the viruses examined here has shown a different geographic distribution, there are some reflections that are notable across all four viruses.
Firstly North East and North Cumbria ICB has been particularly badly affected by the viruses, seeing the highest number of occupied beds per day for both flu and D&V, the second highest for COVID-19 and the fifth highest for RSV. As this ICB has the largest population of all ICBs, one would expect a high number of patients, but it is notable that this ICB had 21.2 per cent of all D&V patients, despite having 5.3 per cent of the national population, and thus has been disproportionately affected by this virus.
Secondly, Hampshire and Isle of Wight ICB has been similarly badly affected; it saw the highest number of occupied beds for RSV, the third highest for both D&V and COVID-19, and the ninth highest for flu. Moreover, this ICB had high levels of bed occupancy when compared with its population for both COVID-19 and RSV.
It is interesting that these two ICBs are at opposite ends of the country, so this is not a localised cluster of high levels of bed occupancy.
On examining the relationship 1 between the number of flu beds and the number of beds occupied by patients with other viruses, we can see that there is a statistically significant positive relationship between flu and both COVID-19 and D&V, meaning that ICBs with higher numbers of flu beds are more likely to see higher numbers for COVID-19 and D&V as well. This is particularly notable for COVID-19; the relationship between flu and D&V is fairly weak, but the relationship between flu and COVID-19 is stronger. 2 The same cannot be said for RSV; there is no statistically significant relationship between RSV and flu beds.
However, it is possible that this is reflective of the size of the population of each ICB. On examining the relationship between flu bed occupancy per 100,000 people, and the same metrics for COVID-19, D&V and RSV, there is no statistically significant relationship for any virus. This means that while an ICB may have high levels of flu bed occupancy per 100,000 people, it is not more likely to have high levels of other virus bed occupancy per 100,000 simultaneously.
Higher numbers of flu beds correlated with higher numbers of COVID-19 and D&V beds, but not paediatric RSV, suggesting that an ICB may require higher numbers of beds for patients of each virus and will therefore be under pressure in multiple areas, which could have a cumulative effect.
However, it is important to consider that the number of beds occupied is not the only way in which a virus can have affected ICBs. High numbers of emergency department attendances, for example, even if they do not lead to an admission, put a great deal of pressure on healthcare systems.
Conclusion
This article has shown that there has been an uneven distribution of the pressure placed on NHS services by viruses over winter. Using week 2 (6 – 12 January 2025) as a snapshot, this article shows that some ICBs have faced particular challenges in terms of the levels of viruses they have seen, as ICBs that saw higher numbers of flu beds are likely to have also seen higher numbers of COVID-19 and D&V beds as well. Although this may be reflective of the size of the population of the ICB in question, this large number of beds across multiple different viruses will be putting pressure on the healthcare system.
While all ICBs have faced challenges over the winter months, regardless of virus levels, this additional pressure should be taken into account when the performance of these ICBs is being evaluated.


